
Lesson 1.1: What is Tableau?
Objective:
Welcome to Lesson 1.1, where we will explore Tableau, an amazing tool for showing data in pictures and helping businesses make smart decisions. In this lesson, we’ll learn the basics of Tableau, focusing on how it turns confusing raw data into easy-to-understand representation. This helps companies see and use their data in new and helpful ways. Let’s get started on this journey to make data exciting and useful for everyone!
A Short Introduction of Tableau:
Tableau is a top (Data visualization) tool for looking at business data and making it easy for everyone to understand, no matter how much they know about data. It helps turn basic information into interactive visualizations that can be shared, guiding smart decision-making.
To more simplify, imagine you have a database, like one in Microsoft Excel, filled with various types of data. Whether it’s Big Data, Hadoop, SQL, or any cloud database, Tableau helps you analyze this data by transforming it into easy-to-understand graphs and reports.
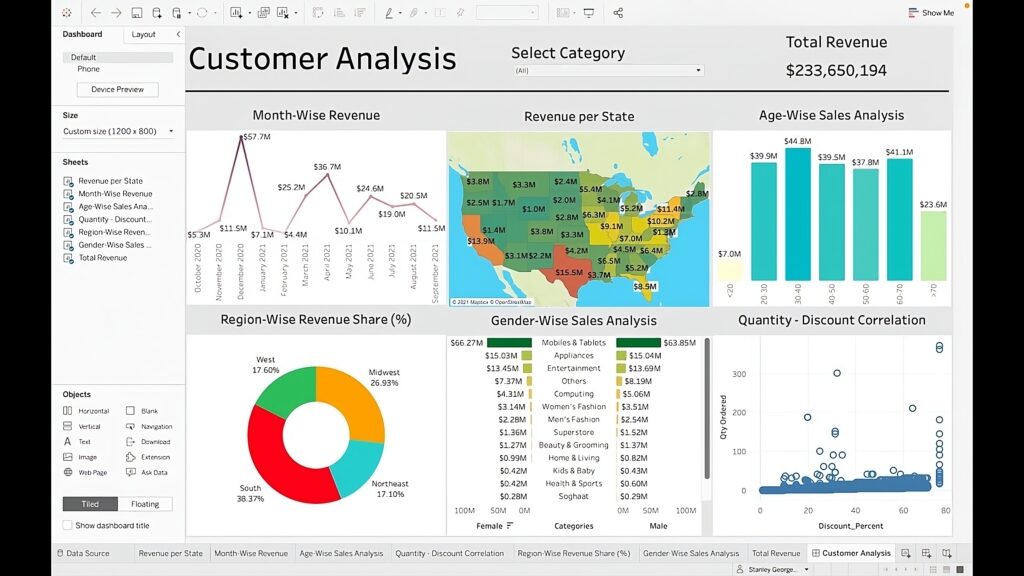
Figure:Tableau Dashboard Sample
Using Tableau, you can explore your data in a simple way, finding trends and important points through various pictures and charts. Its easy drag-and-drop feature makes creating these visuals straightforward, making data clear and useful. Data analysis is very fast with Tableau, and the visualizations created are in the form of worksheets and dashboards. Any professional can understand the data created using Tableau.
Main purpose of Tableau
The core purpose of Tableau is to serve as a business intelligence (BI) tool, facilitating data exploration, analysis, and informed decision-making within organizations. Some of more major objectives includes the following:
- To empower users with the ability to transform complex data into actionable insights through detailed visualizations and analytics.
- To facilitate data-driven decision-making by enabling users to visualize, analyze, and share insights from their data.
- By connecting to various data sources and providing powerful analytical tools, Tableau empowers users to explore data trends, identify patterns, and uncover actionable insights.
- Allowing users to create compelling visualizations and share them across teams and stakeholders through the interactive and collaborative features.
Users of Tableau:
- Tableau has a wide user base across different fields and backgrounds.
- It enables easy exploration of data, suitable for users with varying technical skills.
- Common job titles associated with Tableau include data analyst, business analyst, and analytics consultant.
- It’s versatile and valuable for anyone interested in understanding or presenting data.
- Tableau’s user-friendly interface accommodates individuals with different levels of data analysis experience.
- It’s applicable across industries, not limited to a specific sector.
What problems it solves
Tableau strategically targets the following key problems:
- Tableau focuses on simplifying the understanding of complex datasets through intuitive and interactive visualizations.
- It tackles the issue of disparate data sources by providing easy connection and integration capabilities.
- Tableau ensures timely and up-to-date information by connecting to live data sources.
- It empowers business users to conduct independent ad-hoc analysis, reducing reliance on specialized data experts.
- Despite collaboration challenges, Tableau provides a platform for sharing insights and knowledge among teams.
What are the alternatives but why tableau
While there are numerous alternatives to Tableau exist in data visualization and business intelligence, each with unique features. For example: Microsoft Power BI integrates seamlessly with Microsoft products, QlikView and Qlik Sense focus on associative data modeling, Looker centralizes data modeling, and Domo excels in executive-level reporting. Also, Sisense is known for powerful data preparation, Google Data Studio integrates with Google products, and IBM Cognos Analytics offers robust enterprise-level reporting.
Each of these tools exhibits unique capabilities, and in addition to those, Tableau can be used for the following purposes:
- Tableau emphasizes interactivity, allowing users to explore and interact dynamically with their data, enhancing the analytical experience.
- Tableau offers different licensing options, making it adaptable to various budget constraints and ensuring cost-effective solutions for different user needs.
- Tableau seamlessly integrates with various data sources, making it easier to connect and analyze data from different platforms and systems.
- The active and engaged Tableau community not only provides support but also fosters collaboration and knowledge-sharing among users.
Few practical cases of tableau usage:
Tableau is widely used across various industries for data visualization and business intelligence purposes. Here are a few practical cases showcasing how organizations leverage Tableau:
- Sales Performance Analysis: A sales team uses Tableau to analyze performance metrics, track sales targets, and identify trends. Tableau dashboards, for example, provide real-time insights into individual and team performance, helping sales managers make data-driven decisions, adjust strategies, and optimize sales processes.
- Financial Reporting and Analysis: Financial analysts utilize Tableau for financial reporting and analysis. Tableau enables the creation of interactive financial dashboards, allowing analysts to explore budget variances, monitor key financial indicators, and communicate financial insights to stakeholders in a visually compelling manner.
- Healthcare Data Visualization: Healthcare organizations employ Tableau to visualize patient outcomes, hospital performance, and medical research data. Tableau helps healthcare professionals identify patterns, monitor patient outcomes, and improve operational efficiency by visualizing data related to patient care, resource utilization, and medical research.
- Supply Chain Management: Supply chain leaders utilize Tableau to analyze and optimize supply chain operations. Tableau dashboards provide real-time visibility into inventory levels, demand forecasting, and logistics performance, enabling better decision-making to ensure a smooth and efficient supply chain.
- Marketing Analytics: Marketing teams leverage Tableau for campaign performance analysis and tracking. Tableau enables marketers to visualize key metrics such as click-through rates, conversion rates, and customer segmentation. This helps in optimizing marketing strategies and allocating resources effectively.
- Human Resources Metrics: HR departments use Tableau for visualizing employee data and workforce analytics. Tableau helps HR professionals track employee engagement, turnover rates, recruitment metrics, and workforce demographics. This aids in making informed decisions related to talent management and organizational development.
- Educational Institutions: Universities and schools apply Tableau for student performance analysis and institutional reporting. Tableau facilitates the creation of interactive dashboards that showcase student performance, enrollment trends, and other key educational metrics, aiding educators and administrators in data-driven decision-making.
These practical cases demonstrate the versatility of Tableau in various domains, emphasizing its role in transforming raw data into actionable insights for informed decision-making.