
Lesson 1.2: Key Features of Tableau
Objective:
Lesson 1.2 is to familiarize with the key features of Tableau, providing a foundational understanding of its user-friendly interface, data accessibility, visualization options, and analytical tools. By the end of this lesson, participants should be equipped to recognize and utilize the core functionalities that make Tableau a powerful tool for creating interactive dashboards and visualizations without extensive programming skills.
Features of Tableau:
- Tableau stands out as a strong and user-friendly data visualization application, enabling the easy creation of interactive dashboards without requiring extensive programming skills.
- Tableau features include easy access to various data sources, a variety of visualization options, and tools such as drag-and-drop capability and real-time data connections.
- Its capacity to handle large datasets, along with advanced analytics features like predictive modeling, makes it an essential tool for enterprises. Tableau’s popularity is rooted in its user-friendly interface, extensive data connectors, and robust visualization and analytics tools, catering to a wide range of users, from corporations to nonprofits.
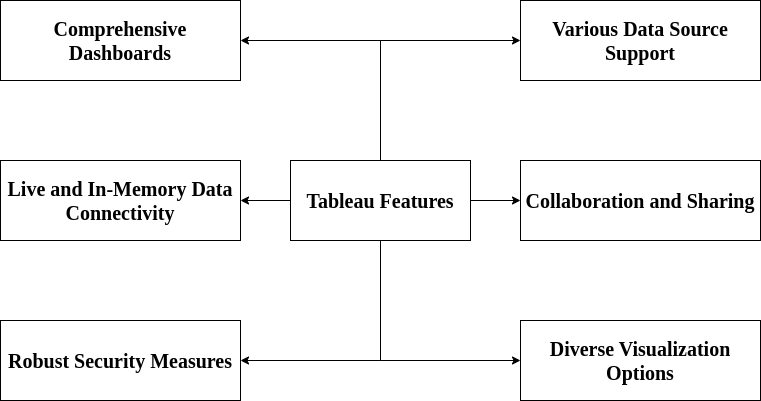
These are the most interesting features of Tableau:
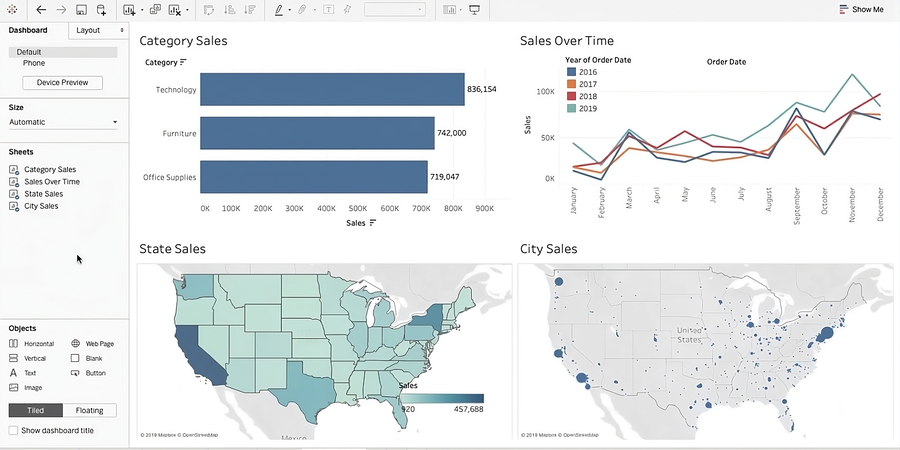
Comprehensive Dashboards: Tableau’s dashboards integrate images, visual elements, and text to offer a holistic data view, supporting storytelling, various views, and flexible layouts for enhanced presentation.
Example: A sales manager analyzing quarterly performance can utilize Tableau to create a comprehensive dashboard. This dashboard integrates sales data, customer feedback, and market trends through visualizations like bar charts, line graphs, and maps, providing a holistic understanding for informed decision-making.
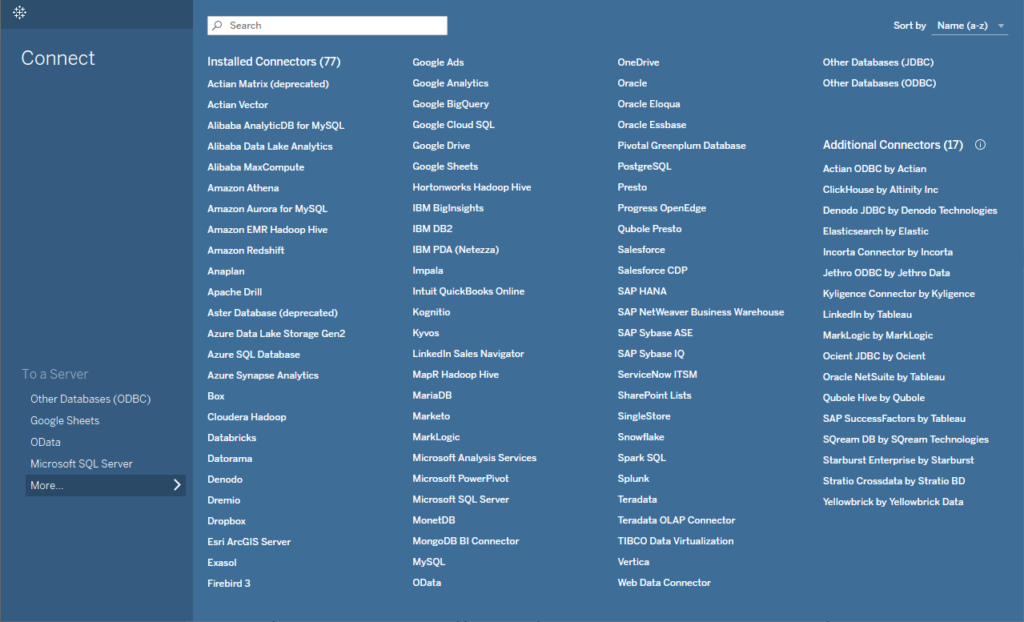
Various Data Source Support: You can connect to various data sources without any programming, such as Redshift, Cloudera Hadoop, SQL Server, Salesforce, Google Analytics and Google Sheets, MongoDB, PDF files, Dropbox, Amazon Athena, and more.
Example: A marketing analyst analyzing campaign performance across various channels can leverage Tableau’s versatile data source support. By seamlessly connecting to data from Google Analytics, Salesforce, and local spreadsheets, the analyst gains a comprehensive view of campaign effectiveness and optimizes future strategies.
Live and In-Memory Data Connectivity: Tableau offers both live and in-memory data connections, enabling users to combine data from multiple sources. Additional capabilities include automated extract refreshes and notifications of live connection failures.
Collaboration and Sharing: Tableau facilitates real-time communication and secure data sharing through visualizations and dashboards. It supports collaboration across various sources, promoting instant input for a more thorough analysis.
Example: A project manager collaborating on a marketing campaign can create interactive dashboards in Tableau, showcasing performance metrics. Securely sharing these dashboards enables real-time collaboration and feedback, fostering informed decision-making and project success.
Robust Security Measures: Tableau prioritizes data and user security through authentication and authorization mechanisms. It integrates with security protocols like Active Directory and Kerberos, employing row-level filtering for enhanced data security.
Example: A healthcare administrator analyzing patient data ensures compliance with privacy regulations using Tableau’s robust security measures. Role-based access control, integration with Active Directory, and row-level filtering ensure data access is limited to authorized personnel for enhanced security.
Diverse Visualization Options: Tableau’s success is attributed to its extensive range of visualizations, allowing users to create anything from simple bar charts to complex options like histograms and Gantt charts. Visualizations are easily selected and created through the intuitive Show Me menu.
Example: A data scientist analyzing customer purchasing behavior for an e-commerce company can leverage Tableau’s diverse visualizations. Utilizing pie charts, scatter plots, and heat maps, the data scientist gains deeper insights into customer behavior, informing targeted marketing strategies and product recommendations.