Lesson 2.2: Sum Average and Count Functions In Excel
Objective:
The Sum, Average, and Count Functions stand out as fundamental and versatile tools within Excel, representing some of the most commonly employed functions. These tools are indispensable for data analysts, offering essential means to extract valuable insights and facilitate informed decision-making through the analysis of numerical data. Our objective is to prepare you with the proper knowledge and skills you need to complete the full potential of these functions in enhancing your data analysis capabilities.
SUM Function in Excel:
The SUM Function in Excel falls within the category of Math functions. Its primary purpose is to calculate the total sum of cells provided as multiple arguments. SUM enables users to compute the summation results of specific cells within a worksheet.
Formula Syntax:
- =SUM(number1, [number2], [number3], …)
Arguments Used by SUM Function:
- Number1 (required): The initial item intended for summation.
- Number2 (required): The second item to be included in the sum.
- Number3 (optional): An optional third item for summation.
The function accommodates up to 255 arguments, allowing users to input values in various formats such as numbers, cell references, ranges, arrays, constants, or even the outcomes of other formulas or functions.
How to Utilize the SUM Function in Excel:
- Basic Summation: =SUM(A1:A10) This formula sums the values in cells A1 through A10.
- Multiple Arguments: =SUM(B1, C3, D5) Sums the values in cells B1, C3, and D5 individually.
- Combining with Functions: =SUM(A1:A5, C1:C5) combines two ranges to obtain their total sum.
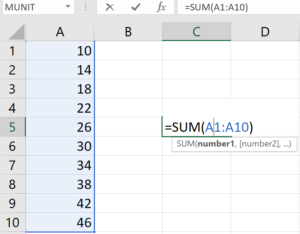
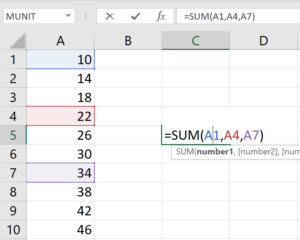
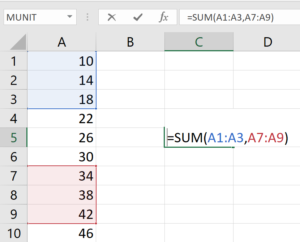
Figure: Basic, Multiple argument and combining with functions using SUM
Let’s consider a practical scenario related to managing sales data for a hypothetical company. Imagine you have a spreadsheet with the following columns:
Product Name: Names of different products.
Sales Amount: The sales amount for each product.
Region: The region where the sales occurred.
Now, let’s perform SUM and SUMIF calculations using Excel functions:
We want to calculate the SUM of total sales and the SUM of total sales in the “South Asia” region. To do this, let’s follow the following process:
In cell B14, write the formula =SUM(B2:B11) to calculate the total sales amount for all products.
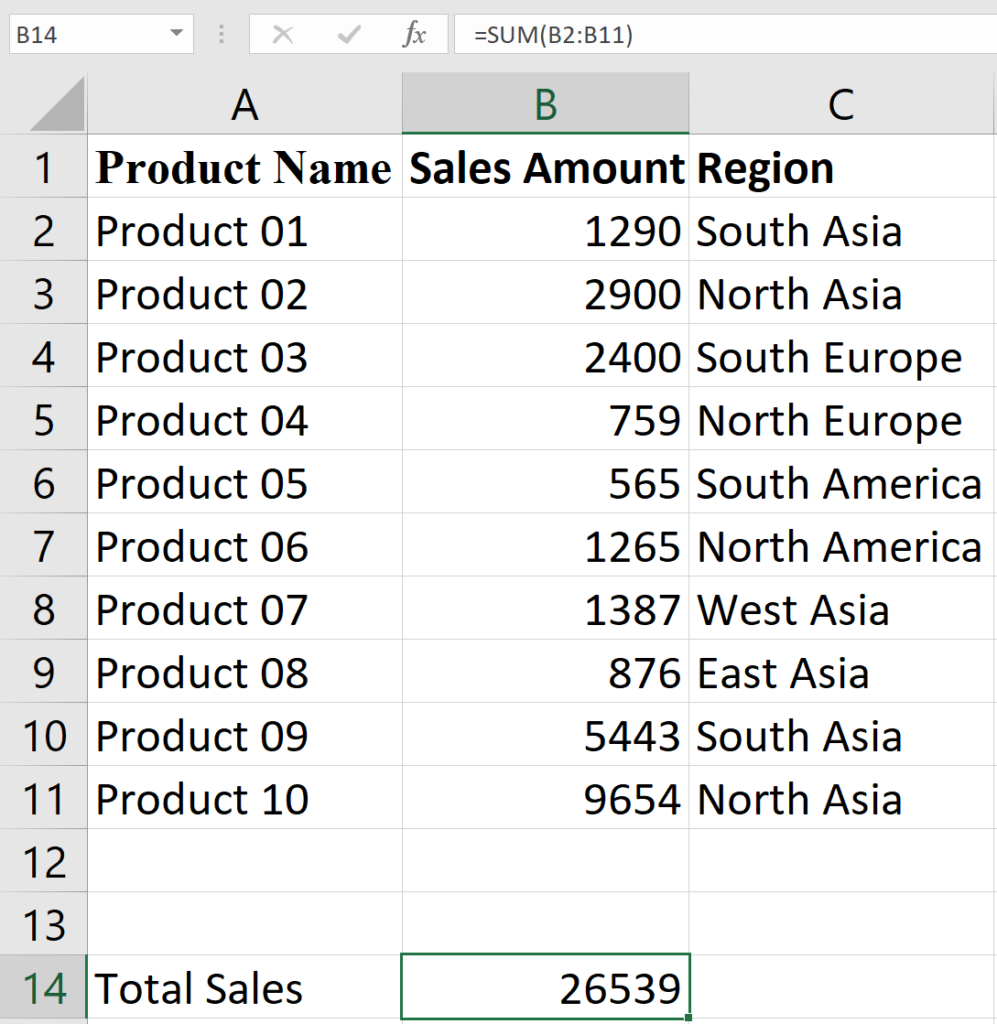
Figure: Total sales
In cell E3, write the formula =SUMIF(C2:C11, “South Asia”, B2:B11) to calculate the total sales amount for products in the “South Asia” region.
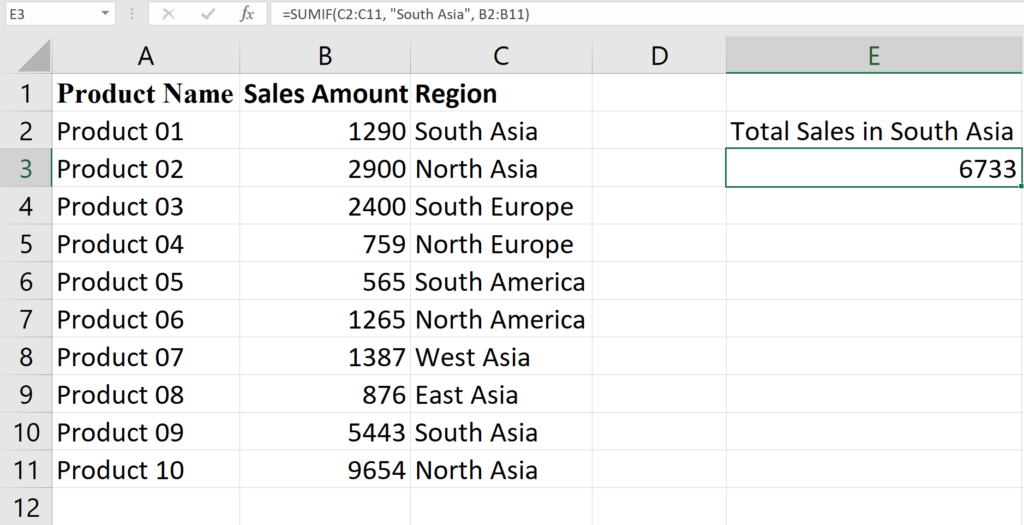
Figure: Total sale in South Asia region
MS Excel’s AVERAGE function:
MS Excel’s AVERAGE function is a statistical function. The average formula in Excel calculates the arithmetic mean of a data series. It adds all the values of the variable we assigned and divides them by the number of values added.
- Using an average function when calculating the average number of pages read per day by selecting the range containing the daily page counts.
For example, if you’ve recorded the number of pages read each day in a spreadsheet, you’d use the average function to swiftly compute the average pages read per day over the week. This calculation helps you measure your regular reading speed and plan your future reading goals accordingly.
Formula of the AVERAGE function
- =AVERAGE (number1, [number2], …)
The AVERAGE function has the following arguments
- Number1 – Required. The first number, cell reference, or range for which you want to calculate the average.
- Number2 – Optional. Additional numbers, cell references, or ranges for which you want to calculate the average. The max count is 255.
How to Apply the AVERAGE Function?
We will use the same scenario as the SUM functions and in this case, we want to calculate the AVERAGE sales and the AVERAGE sales in the “South Asia” region. Similarly, the processes are following:
In cell B15, write the formula =AVERAGE(B2:B11) to calculate the average sales amount for all products.
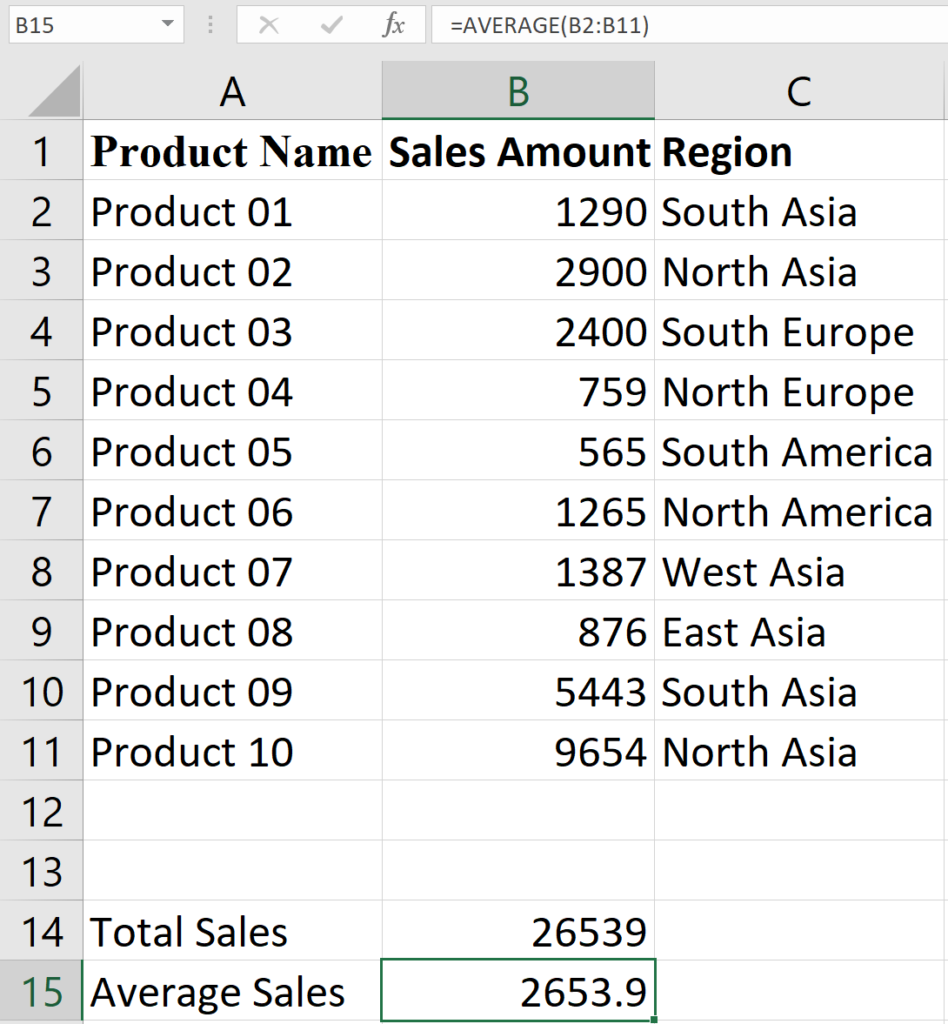
Figure: Average sales
In cell E5, write the formula =AVERAGEIF(C2:C11, “South Asia”, B2:B11) to calculate the total sales amount for products in the “South Asia” region.
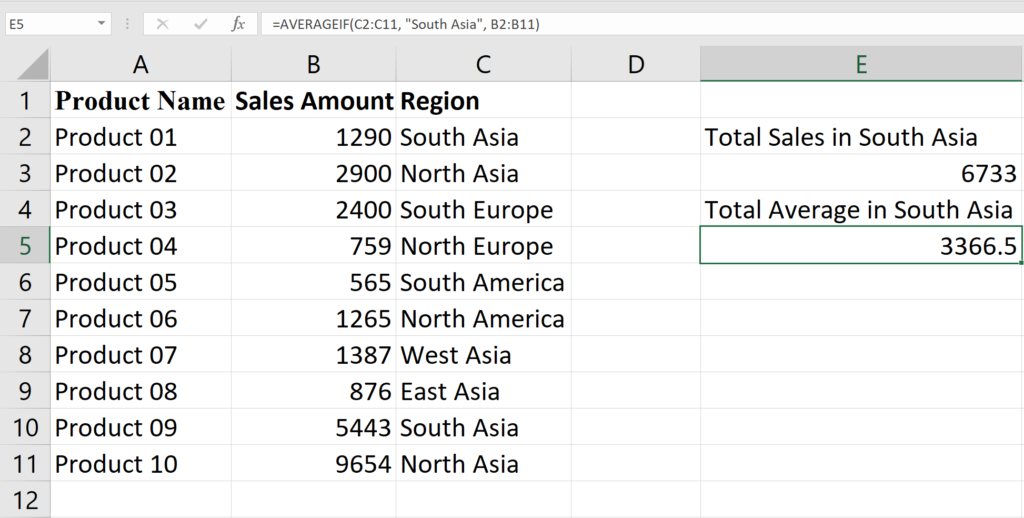
Figure: Average sale in South Asia region
COUNT Function in Excel:
In Microsoft Excel, the COUNT function is used to count the number of cells in a range that contain values. It does not count empty cells or cells that contain text, errors, or logical values.
- Using the Count function when you need to determine the quantity of items in a specified range.
For example, if you maintain a list of tasks for a project, and each task has a unique identifier. By utilizing the Count function on the range containing these identifiers, you can easily find out how many tasks are part of your project.
Formula of the COUNT function
- =COUNT(value1, [value2], …)
The COUNT function has the following arguments
- value1, value2, …: These are the values, cell references, ranges, arrays, or constants you want to count. It counts the number of cells that contain numbers.
How to Apply the COUNT Function?
We will use the same scenario as previous functions and here, we want to count the number of products or sales and the COUNT the number of sales in the “South Asia” region. Similarly, the processes are following:
In cell B17, write the formula =COUNT(B2:B11) to count the total number of sales or total number of products.
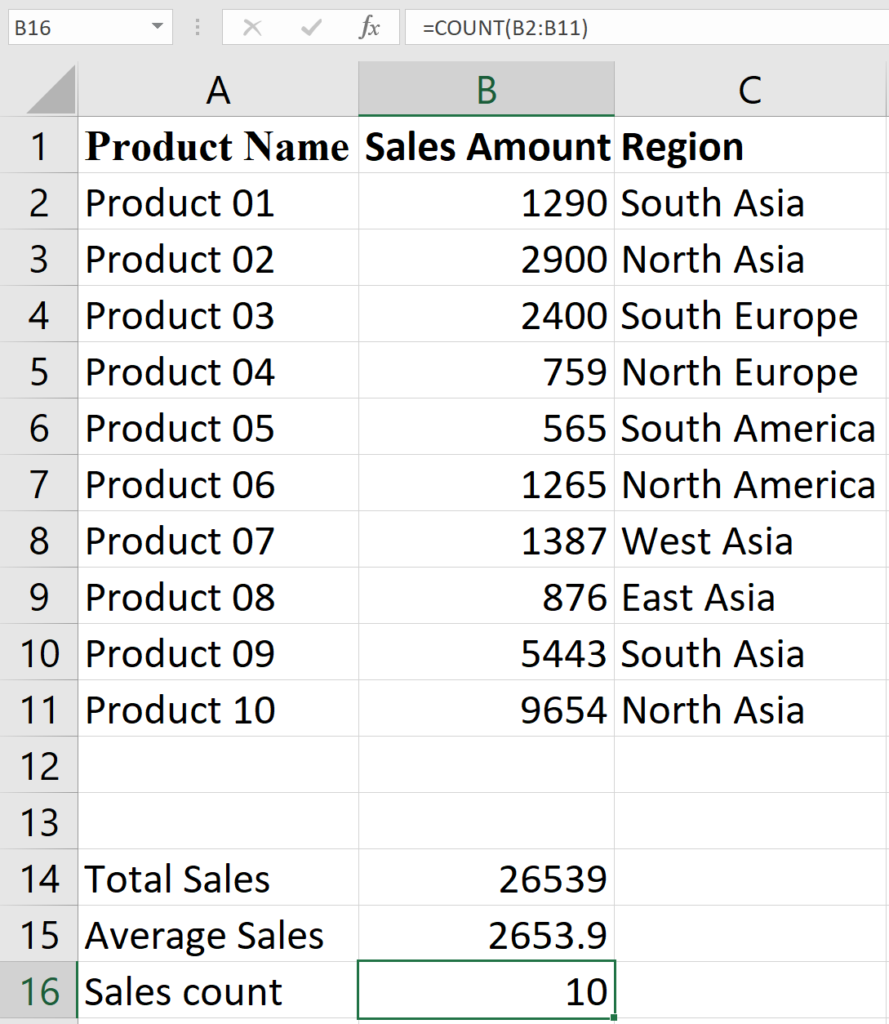
Figure: Total number of sales
In cell E7, write the formula =COUNTIF(C2:C11, “South Asia”) to count the total number of sales in the “South Asia” region.
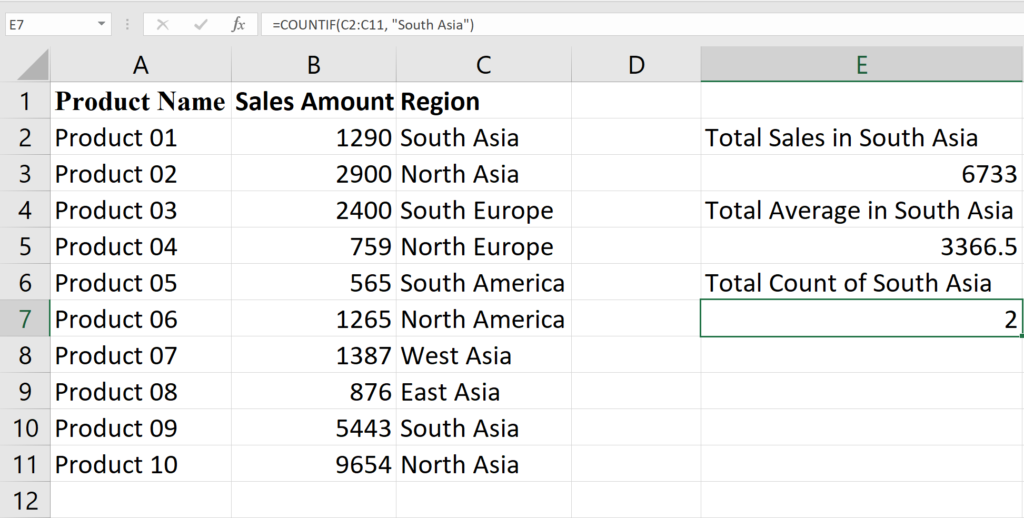
Figure: Number of sales in South Asia region
In Lesson 2.2, you acquired proficiency in three fundamental spreadsheet functions: SUM, AVERAGE, and COUNT, crucial for adeptly managing numerical data. The SUM function adds up values, making it crucial for financial calculations, while the AVERAGE function calculates the mean for insightful data analysis. The COUNT function demonstrated its pivotal role in data validation, providing a means to verify the completeness of datasets by counting the number of numerical entries. As you progress through the lesson, you can explore practical applications in financial analysis, data validation, and statistical reporting to enhance your spreadsheet skills and efficiency.