Lesson 2.4: Data Source Tab in Tableau
Objective:
This lesson focuses on the Data Source tab in Tableau Desktop, providing insights into its purpose and functionality. Understanding the Data Source tab is important for managing and manipulating data effectively within Tableau Desktop. Learn how to perform tasks such as modifying data connections, applying filters, and structuring your data for optimal analysis. The Data Source tab is a crucial component in shaping your data before delving into the visualization process, and this lesson will guide you through its key features.
Once we establish a successful connection with a data source, we can access all its data, bring some part of it in Tableau’s repository (extract) and use it for our analysis. Already we see in ( Lesson 2.3: Connecting to Data Sources )
The Data Source Tab:
- The Data Source tab in Tableau serves as the gateway for connecting to and managing data.
- This tab allows users to establish connections with various data sources, including databases, spreadsheets, and cloud services.
- Through the Data Source tab, users can view, modify, and optimize data connections before visualization.
In general, A Tableau Data Source is the link between the source data and Tableau.
Accessing the Data Source Tab:
Step 1:
When connecting to a data source, such as an Microsoft Excel file, Tableau automatically opens the contents within a Data Source tab in a new workbook. Once connected, Tableau transitions to a new workbook where users can switch to the Data Source tab to view or modify their data as needed.

Figure: The Data Source Tab
- The Data Source Tab includes a Connections pane on its left side, displaying the name of the data source and its contents. For example, in the case of an Excel file, it shows the number of sheets present.
- To manage and view the contents of the data source, users can drag and drop sheets into the central pane. This action displays the entire table with organized rows and columns corresponding to the selected sheet.

Figure: Drag and Drop the Targeted Table
Step 2:
Furthermore, you have the option to incorporate a new data source by selecting the ‘Add’ option. From there, you can choose the desired data file or connector to integrate into the existing data sources.

Figure: Adding a new data source
- Alternatively, you can access the ‘New Data Source’ option by clicking on the ‘Data’ tab located in the top-left bar.

Figure: New Data Source
Step 3:
From this point, users can sort fields and manage metadata, allowing them to view the names of all columns present in their respective tables. This capability also extends to the management of multiple linked data sources.
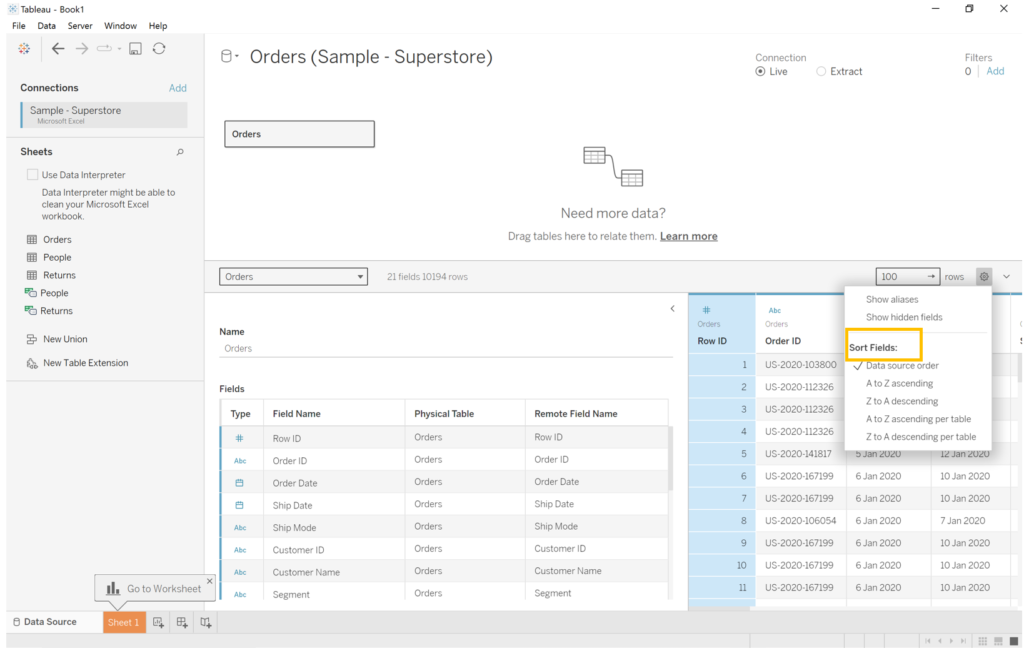
Figure: Sorting fields and managing metadata
Step 4:
After loading our data source, the next step involves creating a worksheet in Tableau. Navigate to the ‘Sheet1’ tab, conveniently located adjacent to the Data Source tab, where you’ll encounter a list of available data sources and their respective fields. On the left side, you’ll find a well-organized list of dimensions and measures. Here, you can easily select and utilize them to craft charts and graphs by simply dragging and dropping dimensions and measures into the Columns and Rows sections.

Figure: Creating a worksheet
In the next section, you will modify the data to customize it for your specific analytical needs before saving the customized version..
Live Connections or Extracts
The Data Source Tab in Tableau provides users with two primary connection options: Live and Extract. Each connection mode serves specific purposes, influencing data accessibility, performance, and real-time updates.

Live Connection:
- Directly links Tableau to the data source, offering real-time access to the latest data.
- Changes in the source data are immediately reflected in Tableau visualizations.
- Ideal for scenarios with large datasets or when continuous real-time data access is essential.
Extract Connection:
- Involves creating a local snapshot or extract of the data at a specific point in time.
- Often results in faster visualization performance as extracts are stored locally.
- Useful when working offline or when continuous real-time access isn’t required.
Notes:
- Data Size: Live connections may face performance challenges with extremely large datasets; extracts can optimize responsiveness.
- Frequency of Updates: The choice depends on how frequently the data source is updated and the necessity for real-time insights.